
The carbon footprint of shipping and transport are detailed in this page. The carbon footprint of a small package that travels 500 miles and weighs about 1 pound can be as low as 0.59 kg CO2e, if it travels via ground, while air shipping would generate 0.98 kg CO2e. However, if you ship a large package that travels approximately 2,500 miles from Los Angeles to New York City, it will generate 1.82 kg CO2e via ground and 8.82 kg CO2e via air travel. The greenhouse gas emissions of the large, air package are 15 times larger than the emission from the small, ground package.The large package traveling by air would emit as much an an entire gallon of gasoline. If you made a dedicated trip to your local store, traveling 6.23 miles round trip, you would generate 2.52 kg CO2e.
When you buy multiple items in the same trip, the carbon footprint per item goes down. Consumer Ecology estimates the average grocery item purchased generates 0.19 kg CO2e per item. How you buy items, and how you transport them makes a big difference in the carbon footprint.
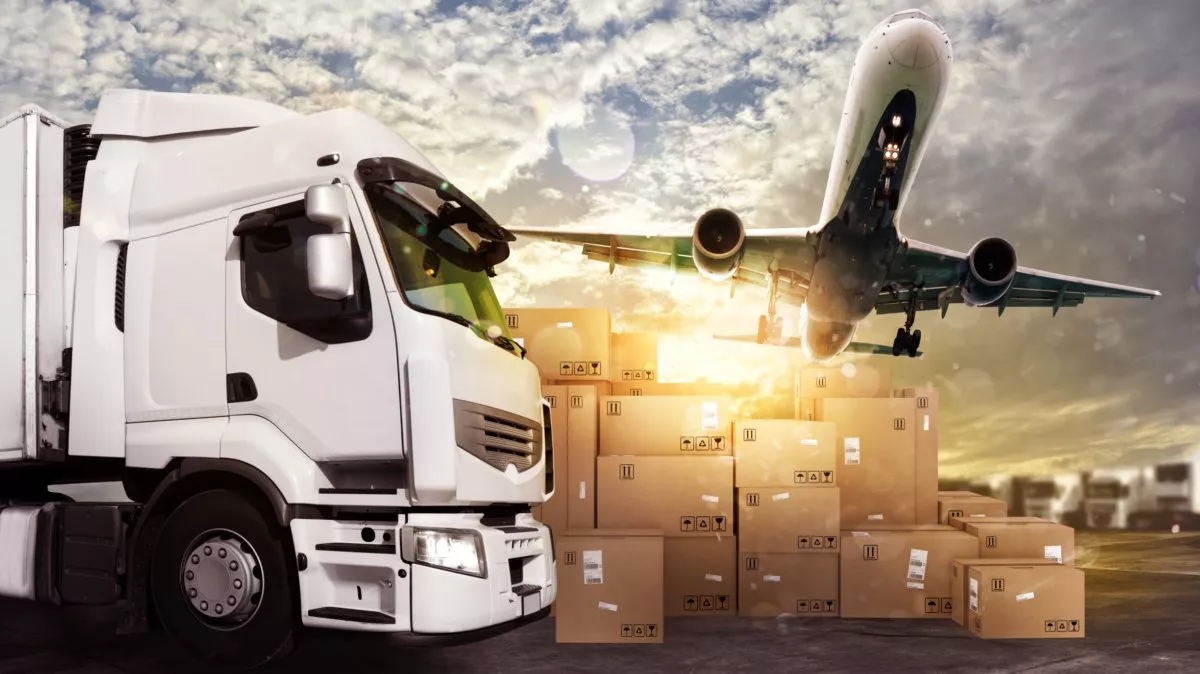
To estimate the carbon footprint of shipping your next package, try the Carbon Footprint of Shipping Calculator in the next section.
Carbon Footprint of Package Shipping Calculator
Carbon Footprint of Packing Paper and Cardboard Box: 2.93 kg CO2e / kg
- Based on the National Council for Air and Steam Improvement (NCASI, 2017) industry report.
- Report assumes a 0.533 kg CO2e / kg cardboard, however the study assumes a 2.4 kg offset due to reforestation that is not clearly described in the study, nor is it apparently clear that this offset can be attributed to the cardboard industry. Thus, the non-offset value of 2.93 kg CO2e / kg cardboard is used instead. This number is assumed for packing paper as well.
- Weights of boxes:
- Weight of kraft paper sheets:
- 8.5 x 11 in. = 2.9 g (ULINE)
Carbon Footprint of LDPE Plastic: 3.56 kg CO2e / kg
- Carbon footprint for LDPE based on Zheng and Suh (2019)
- 12 x 12 in. small bubble sheet: 44 g weight (ULINE)
- 12 x 12 in. large bubble sheet: 82 g weight (ULINE)
- 8 x 4 in. air pillow: 1.4 g weight (ULINE)
Carbon Footprint of Polystyrene Peanuts: 4.96 kg CO2e / kg
- Carbon footprint for polystyrene based on Zheng and Suh (2019)
- 2.48 kg CO2e / lb
- 4.55 ft3 / lb (Uline)
- 550 g CO2e / ft3
- 100 g / ft3
Carbon Footprint of Biodegradable Polystyrene Peanuts: 3.82 kg CO2e / kg
- Carbon footprint for biodegradable polystyrene based on Zheng and Suh (2019)
- 1.91 kg CO2e / lb
- 1.90 ft3 / lb (Uline)
- 1000 g CO2e / ft3
- 240 g / ft3
The carbon footprint of shipping is estimated from various sources. The footprint depends on both the energy used for shipping based on weight and distance, but also on the materials used to ship the package.
UPS (2011) States that the carbon footprint anatomy of an average package is:
- Facilities: 11%
- Pickup and Delivery (Last Mile): 19%
- Transportation Network: 70%
With an average package emissions of 1.19 kg CO2e / package, this corresponds to:
- Facilities: 130 g CO2e
- Pickup and Delivery (Last Mile): 230 g CO2e
- Transportation Network: 830 g CO2e
While UPS has made efforts to reduce their emissions since this time, updated information is not available, and thus the 2011 data must be assumed. In addition, UPS does not give an average weight or distance for their average package, so the Transportation Network emissions cannot be adapted for different package weights or distances, however the Facilities and Pick and Delivery figures will be generalized across the industry, because they are more independent of package weight and distance.
In order to estimate the emissions resulting from shipping, we need emissions from each mode of shipping. These are given in the EPA (2018B) Emissions Factors for Greenhouse Gas Inventories:
- Medium/Heavy-Duty Truck: 180 g CO2e / tonne-mile (200 g CO2e / ton-mile)
- Airplane: 1200 g CO2e / tonne-mile (1320 g CO2e / ton-mile)
For purposes of consumer-level shipping of e-commerce products, only truck and airplane shipping will be considered, because rail service is typically used for transport to commercial vendors.
Carbon Footprint of In-Store Pickup by Automobile
Ver Ploeg et al. (2015) reports in a US Department of Agriculture (USDA) survey, that the average consumer lives 3.8 miles away from their primary shopping store. 94% of these trips are made by car.
Martin et al. (2019) examined a dataset collected by the Nielsen Company, which directly tracked the purchasing of 63,100 american households over 1 year. Consumer Ecology totaled the number of trips, combined with the assumed travel distance in an average car, which gets 22 mpg (EPA, 2018A), to get the average emissions per item purchased at a grocery store. The results are shown in Table 1.
Table 1: Average American Household Shopping Habits and Emissions (Based on Martin et. al (2019) and Ver Ploeg et al. (2015))
The average carbon footprint per grocery item purchased is estimated at 190 g CO2e / item. With an average household size of 2.53 people (US Census Bureau, 2018), Martin et al. (2019) examined purchases made by 159,643 people. This results in an average of 45.85 trips per person per year, or just under one trip per week, the average american will generate 97.08 kg CO2e / yr from grocery shopping, or 1.87 kg CO2e / week. Both of these estimates assume that 94% of trips are made by car and the remaining 6% of trips have no emissions.
Assumptions:
Data from Martin et al. (2019) used to calculate the emissions from grocery shopping excludes liquor stores, hardware stores, and pet stores, because they do not sell food for human consumption.
There is not accurate data on how far the average consumer is from each of the store types listed in Martin et al. (2019), and thus assumptions were made about the distance to the nearest store. The assumptions are as follows:
- Grocery stores, discount stores, warehouse stores, and dollar stores are all interpreted as the “usual store,” per Ver Ploeg et al. (2015) and are assigned a one-way distance of 3.8 miles from home.
- Drug stores and convenience stores are proxied as the “nearest SNAP authorized supermarket,” from ver ploeg et al. (2015) with a distance of 2.2 miles. This number is a proxy estimate, not based on reported data.
- Gas stations are assigned 0 miles, indicating that purchases are made only when buying gasoline, or during a trip to another location, and thus emissions directly for the purchase of food are not attributed to purchases at gas stations.
- Distance traveled is assumed as two-way trips for 64% of trips made, while 36% of trips made are assumed as one-way trips that occur on mixed use shopping or traveling from work, as cited by Ver Ploeg et al. (2015), which obtained this data from the American Time Use Survey. The total trip distance is assumed to be 1.64x the one way trip distance. Additionally, the 1-way trip distance is reported as the euclidian distance, and not the actual distance traveled.
References
EPA: Environmental Protection Agency. (2018A). Greenhouse Gas Emissions from a Typical Passenger Vehicle. See Link to Source
EPA: Environmental Protection Agency. (2018B). Emission Factors for Greenhouse Gas Inventories. See Link to Source
Martin, J., Nenycz-Thiel, M., Dawes, J., Tanusondjaja, A., Cohen, J., & McColl, B. (2019). Fundamental Basket Size Patterns and Their Relation to Retailer Performance. Available at SSRN 3396827.
National Council for Air and Stream Improvement: NCASI. (2017). 2014 Life Cycle Assessment of U.S. Average Corrugated Product.
Supermarket News. (2018). Grocery Shopping Has a Hold on Consumers, Study Finds. See Link to Source
UPS: United Parcel Service. (2011). UPS Corporate Sustainability Report.
US Census Bureau (2018). Historical Household Tables. Table HH-4. Households by Size: 1960-Present. See Link to Source
Ver Ploeg, M., Mancino, L., Todd, J. E., Clay, D. M., & Scharadin, B. (2015). Where do Americans usually shop for food and how do they travel to get there? Initial findings from the National Household Food Acquisition and Purchase Survey (No. 1476-2017-3882).
Zheng, J., & Suh, S. (2019). Strategies to reduce the global carbon footprint of plastics. Nature Climate Change, 9(5), 374.
