Per 15g Protein Serving (4 ounces)
Carbon
Footprint
Square
Footprint
Water
Footprint

0.48 kg CO2e
6.04 ft2
1.87 Gallons

Monthly Choice
Weekly Choice
Daily Choice
Best Choice
Food Waste


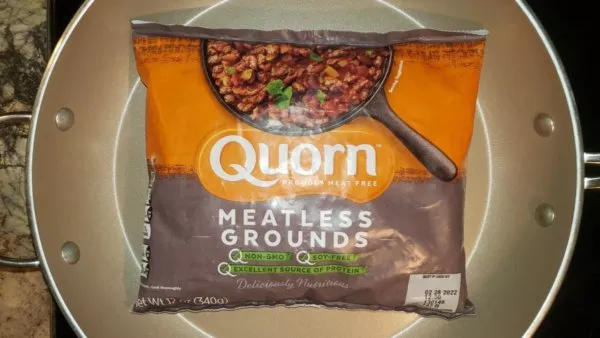
Consumers are estimated to waste on average 20% of all Quorn Meatless Grounds purchased (USDA ERS, 2019; based on beef).

Food waste increases the environmental impact of Quorn Meatless Grounds by 25%
Consumers are estimated to waste on average 20% of all Quorn Meatless Grounds purchased (USDA ERS, 2019; based on beef).
Carbon Footprint


If you ate 4 ounces of Quorn Meatless Grounds every day for a year, you would use:
19.6
Gallons of Gasoline Equivalent
174.5
kg CO2e
If you ate 4 ounces of Quorn Meatless Grounds every day for a year, you would use:
19.6
Gallons of Gasoline Equivalent
174.5
kg CO2e
The Cradle to Grave Carbon Footprint of Quorn Meatless Grounds is 4.23 kg CO2e per kg. The greenhouse gas emissions of Quorn Meatless Grounds are 13.9 times lower than Beef.
-
31.10 g CO2e / g protein
-
9.30 kg CO2e / 2,000 kcal
-
4.23 kg CO2e / kg
-
1.92 kg CO2e / lb
-
136.0 g protein / kg (Source: Manufacturer Packing)
-
910 kcal / kg (Source: Manufacturer Packing)
Carbon Footprint of Gasoline: 8.89 kg CO2e / gallon
-
Based on EIA (2016)
Carbon Footprint of Quorn Mince at the Processor Gate: 1.74 kg CO2e / kg
-
Carbon footprint reported by Hsu et al. (2018). The Carbon Trust was hired by Marlow Foods Ltd, who owns the Quorn brand.
-
The Carbon Trust does not report any modeling values used in their Life Cycle Analysis (LCA), and thus the assumptions made cannot be verified by Consumer Ecology.
-
Smetana et al. (2015) reports a Cradle to Plate Carbon Footprint of 5.55 – 6.15 kg CO2e / kg for mycoprotein. The study reports two additional values for mycoprotein from Blonk et al. (2008), which reports a Carbon Footprint of 2.4 kg CO2e / kg, and from Head et al. (2011), which reports a Carbon Footprint of 2.6 kg CO2e / kg.
-
The reported Carbon Footprint of mycoprotein is therefore in relative agreement with the Carbon Footprint of Quorn reported by the Carbon Trust, which is 4.23 kg CO2e / kg for a similar Cradle to Grave LCA to the Cradle to Plate LCA reported by Smetana et al. (2015).
Carbon Footprint at Retail Gate: 2.40 kg CO2e / kg
-
Transport emissions of 0.20 kg CO2e / kg to retail. Consumer Ecology uses the value reported by Poore & Nemeck (2018) for “Processed and Preserved Meat.”
-
Retail storage emissions of 0.36 kg CO2e / kg at retail. Consumer Ecology uses the value for Frozen Meat, discussed on the Carbon Footprint From the Regional Distribution Center to Retail Page.
-
Loss emissions at retail of 0.10 kg CO2e / kg. The USDA ERS Loss Adjusted Food Availability (2019) reports a retail loss of 4.3% for the proxy value of Beef in the United States.
Carbon Footprint of Transport From Retail to Home: 0.67 kg CO2e / kg
-
Assumed 1 package (340 g) purchased
Carbon Footprint of Cooking: 0.38 kg CO2e / kg
-
Cooked from 0 degrees frozen to 160 degrees internal for 10 minutes on a 1,600 g 12 inch aluminum frying pan on medium heat. For portions serving 5-7 people, a second pan is modeled and total food mass is assumed to be split between the two pans.
-
Serving size is 4 ounces (113 g).
-
Heat capacity of beef is proxied: 3.52 J / g*C (Engineering ToolBox, 2003)
-
Cooking time based on manufacturer website: Quorn (2020).
-
For energy use calculators and the proportion of US Household size used to determine cooking proportions, see the “Carbon Footprint of Cooking” page.
-
Source: Carbon Footprint of Cooking
Carbon Footprint of Consumer Food Loss: 0.79 kg CO2e / kg
-
The USDA ERS Loss Adjusted Food Availability (2019) reports a consumer loss of 20% for the proxy value of Beef in the United States.
Carbon Footprint of Disposal: 0.07 kg CO2e / kg
-
20% wasted
-
Source: Carbon Footprint of Food Disposal
Cradle to Grave Carbon Footprint: 4.23 kg CO2e / kg
Additional Assumptions:
-
Energy use from refrigeration at home is not considered. The electricity load of a refrigerator is considered separate from the foods placed inside of it, because it is assumed that every household has a refrigerator, regardless of how much food is in it. The individual load of opening the refrigerator for one item has been estimated to be around 2 g CO2e / opening (0.02 MJ / opening; Terrell, 2006), and thus does not meet the cutoff for sensitivity of carbon footprints set at 2 significant digits for kg CO2e.
Square Footprint


If you ate 4 ounces of Quorn Meatless Grounds every day for a year, you would use:
15
Parking Spaces Equivalent
2,204
ft2
If you ate 4 ounces of Quorn Meatless Grounds every day for a year, you would use:
15
Parking Spaces Equivalent
2,204
ft2
The Cradle to Grave Square Footprint of Quorn Meatless Grounds is 54.43 ft2 per kg. The land use of Quorn Meatless Grounds is 35.1 times lower than Beef.
0.393 ft2 / g protein
117.42 ft2 / 2,000 kcal
53.43 ft2 / kg
24.23 ft2 / lb
149 g protein / kg (Source: Manufacturer Packing)
986 kcal / kg (Source: Manufacturer Packing)
Square Footprint of Quorn Mince at Processor Gate: 3.80 m2 / kg
Land Use reported by Hsu et al. (2018). Carbon Trust was hired by Marlow Foods Ltd, who owns the Quorn brand.
The Carbon Trust does not report any modeling values used in their Life Cycle Analysis (LCA), and thus the assumptions made cannot be verified by Consumer Ecology.
Smetana et al. (2015) reports a Cradle to Plate Land Use of 0.79 – 0.84 m2 / kg for Mycoprotein. The study reports two additional values for mycoprotein from Blonk et al. (2008), which reports a Land Use of 0.41 m2 / kg, and from Head et al. (2011), which reports a Land Use of 1.2 m2 / kg.
The reported Land Use of Quorn Mince is 3.2 – 9.3 times higher than the Land Use values reported for mycoprotein by Smetana et al. (2015). Carbon Trust (2018) reports an independent value for mycoprotein of 1.8 m2 / kg for mycoprotein alone at the Processor Gate. This value is in closer to agreement with the values reported by Smetana et al. (2015).
Consumer Ecology concludes the Land Use value reported by the Carbon Trust (2018) is in relative agreement with the values reported by Semtana et al. (2015).
Square Footprint at Retail Gate: 42.74 ft2 / kg
Loss of 4.3% based on the proxy value for Beef in the United States (USDA ERS Loss Adjusted Food Availability, 2019).
Total retail food loss of 4.3% increases the Square Footprint by 0.17 m2 / kg, or 4.5%.
Retail gate value of 3.97 m2 / kg is converted to ft2 / kg.
Square Footprint After Consumer Food Waste: 53.43 ft2 / kg
The USDA ERS Loss Adjusted Food Availability (2019) reports a consumer loss of 20% for the proxy value of Beef in the United States.
Total consumer food loss of 20% increases the Square Footprint by 10.69 ft2 / kg, or 25%.
Water Footprint


If you ate 4 ounces of Quorn Meatless Grounds every day for a year, you would use:
4.6
Hours in the Shower Equivalent
683
Gallons of Water
If you ate 4 ounces of Quorn Meatless Grounds every day for a year, you would use:
4.6
Hours in the Shower Equivalent
683
Gallons
The Cradle to Grave Water Footprint of Quorn Meatless Grounds is 16.6 gallons per kg. The water use of Quorn Meatless Grounds is 27.4 times lower than Beef.
0.122 gallons / g protein
36.4 gallons / 2,000 kcal
16.6 gallons / kg
7.5 gallons / lb
149 g protein / kg (Source: Manufacturer Packing)
986 kcal / kg (Source: Manufacturer Pack
Water Footprint of Quorn Mince at Processor Gate: 48.0 L / kg
Water Use reported by Hsu et al. (2018). Carbon Trust was hired by Marlow Foods Ltd, who owns the Quorn brand.
The Carbon Trust does not report any modeling values used in their Life Cycle Analysis (LCA), and thus the assumptions made cannot be verified by Consumer Ecology.
Assumptions of agreement with additional sources are discussed in the Carbon Footprint and Square Footprint Data & Assumptions Sections.
Water Footprint at Retail Gate: 13.25 gallons / kg
Loss of 4.3% based on the proxy value for Beef in the United States (USDA ERS Loss Adjusted Food Availability, 2019).
Total retail food loss of 4.3% increases the Water Footprint by 2.16 L / kg, or 4.5%.
Retail gate value of 50.16 L / kg is converted to gallons / kg.
Water Footprint After Consumer Food Waste: 16.6 gallons / kg
The USDA ERS Loss Adjusted Food Availability (2019) reports a consumer loss of 20% for the proxy value of Beef in the United States.
Total consumer food loss of 20% increases the Water Footprint by 3.31 gallons / kg, or 25%.
References
Blonk, H., Kool, A., Luske, B., de Waart, S., & ten Pierick, E. (2008). Milieueffecten van Nederlandse consumptie van eiwitrijke producten: gevolgen van vervanging van dierlijke eiwitten anno 2008. Blonk Milieu Advies.
Energy Information Administration (EIA; February 2, 2016). Carbon Dioxide Emissions Coefficients. See Link to Source
Head, M., Sevenster, M. N., & Croezen, H. J. (2011). Life cycle impacts of protein-rich foods for superwijzer. CE Delft.
Home Water Works. (2019). Showers. See Link to Source
Hsu, K., Kazer, J., & Cumberlege, T. (2018). Quorn footprint comparison report. Carbon Trust Advisory Limited, London. See Link to Source
Franklin Street. (May 23, 2019). How Large is a Parking Space? See Link to Source
Poore, J., & Nemecek, T. (2018). Reducing food’s environmental impacts through producers and consumers. Science, 360(6392), 987-992.
Quorn. (2020). Quorn Mince. See Link to Source
Smetana, S., Mathys, A., Knoch, A., & Heinz, V. (2015). Meat alternatives: life cycle assessment of most known meat substitutes. The International Journal of Life Cycle Assessment, 20(9), 1254-1267.
Terrell, W. (2006). Energy Requirements of Refrigerators Due to Door Opening Conditions. International Refrigeration and Air Conditioning Conference. Paper 836.
The Engineering ToolBox. (2003). Specific Heat of Food and Foodstuff. See Link to Source
USDA ERS: US Department of Agriculture Economic Research Service. (2019). Loss-Adjusted Food Availability. See Link to Source
