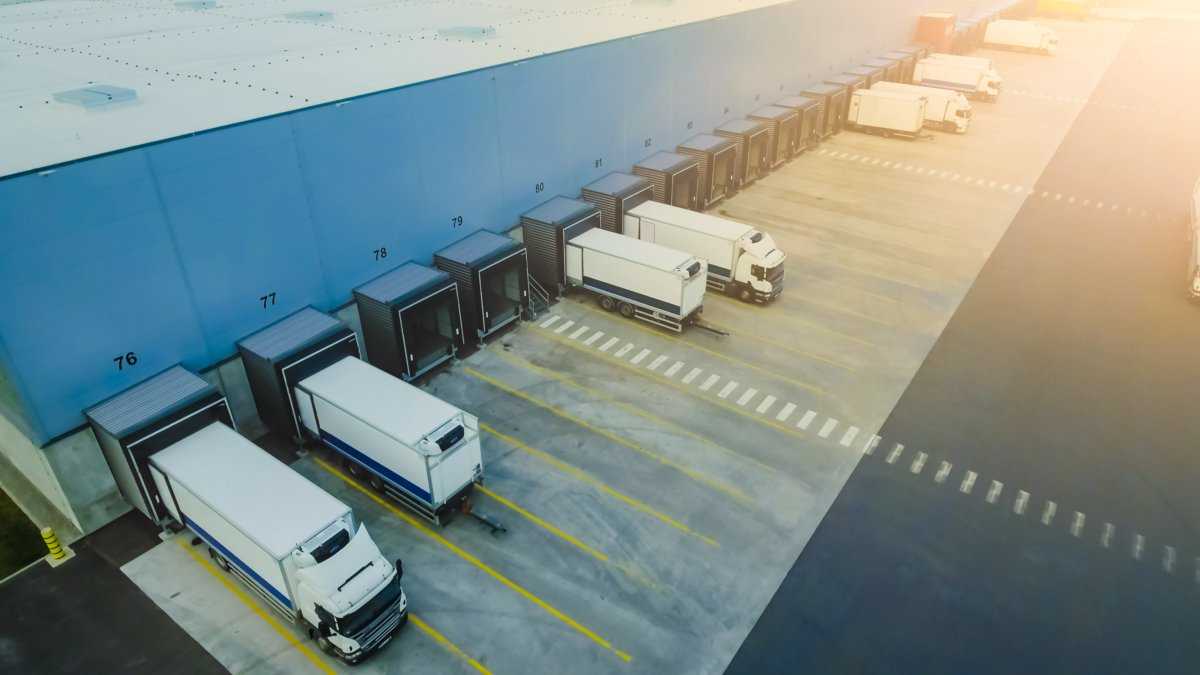

The carbon footprint incurred from transportation from the regional distribution center to retail, and storage at retail is outlined below. These carbon footprints are based on the average distance traveled from the regional distribution center to retail, and the average storage times at retail. The carbon footprint for each type of food is:
- Fresh Produce: 72.6 g CO2e / kg
- Frozen Produce: 405.2 g CO2e / kg
- Fresh Meat: 237.6 g CO2e / kg
- Frozen Meat: 474.5 g CO2e / kg
- Non Perishable Food: 128.0 g CO2e / kg
Distance From the Regional Distribution Center to Retail: 243.3 miles
- Distance is an average value from 3 reports in the United States.
- Ostrander (2011) reports an average distance of 115.3 miles from the regional distribution center to retail for Walmart stores.
- Food Logistics (2009) reports an average distance of 205 miles from the regional distribution center to retail for Safeway stores.
- Spielman (2007) reports an average distance of 409.5 miles from the regional distribution center to Misoula, Montana for 17 different distributors.
- Kroger (2015) reports that “The first tier consists of local dry grocery, perishables and freezer facilities that service stores – generally within a 200-mile radius – with quick turn and perishable products” (p. 56) and “The second tier consists of regional centers that service retail stores – within a roughly 350-mile radius – for slower turn pharmaceuticals, health and beauty care items and dry grocery merchandise” (p.56).
- This value is in line with the average distance reported from the previous 3 values.
Carbon Footprint of Transport From the Regional Distribution Center to Retail: 43.8 g CO2e / kg (Room Temperature) & 119.2 g CO2e / kg (Refrigerated)
- Medium/Heavy-Duty Truck: 180 g CO2e / tonne-mile (200 g CO2e / ton-mile; EPA, 2018A)
- Refrigerated Truck (7.5-15 tonnes): 0.490 kg CO2e / tonne-mile (0.302 kg CO2e / tonne-km; Heller, 2017)
Carbon Footprint at Retail:
Fresh Produce: 28.8 g CO2e / kg
Frozen Produce: 286.0 g CO2e / kg
Fresh Meat: 118.4 g CO2e / kg
Frozen Meat: 355.3 g CO2e / kg
Non Perishables: 84.2 g CO2e / kg
Data and Assumptions
- i Canals et al. (2007) reports the following energy use for storage at retail
- Room Temperature: 0.027 MJ/kg/day. Assuming 44% as electricity and 56% as heating via natural gas.
- Refrigerated: 0.06 MJ/kg/day. Assuming 100% as electricity.
- Frozen: 0.18 MJ/kg/day. Assuming 100% as electricity.
- Estimated retail storage time for produce is 12.6 days, based on a reported 5 year average inventory turnover rate of 29.02 times per year for fruit and vegetable markets (The Retail Owners Institute, 2018A)
- Estimated retail storage time for meat is 15.6 days, based on a reported 5 year average inventory turnover rate of 23.34 times per year for meat markets (The Retail Owners Institute, 2018B)
- Estimated retail storage time for non perishable foods is 37.2 days.
- Estimated retail storage time for non-perishable foods is 25.0 days, based on a reported 5 year average inventory turnover rate of 14.6 times per year for supermarkets and grocery stores (The Retail Owners Institute, 2018C)
- The Food Marketing Institute (2018) reports that 53.42% of supermarket sales were for perishable goods. 20% of reported perishable meats are allocated to “Meat Markets,” 12.02% of perishable produce is allocated to “fruit and vegetable markets,” and the remaining 21.4% of goods is assumed to be split between the two values. The remaining 46.58% of sales is calculated by assuming the proportional turnover rates of “fruit and vegetable markets” and “meat markets” to average 25.0 days for the remainder.
- The average US electricity grid emits 126.53g CO2e / MJ (EPA, 2018), and natural gas emits 50.3g CO2e / MJ (EIA, 2018).
References
Clune, S., Crossin, E., & Verghese, K. (2017). Systematic review of greenhouse gas emissions for different fresh food categories. Journal of Cleaner Production, 140, 766-783.
EIA: US Energy Information Administration. (2018) How much carbon dioxide is produced when different fuels are burned? Retrieved From: https://www.eia.gov/tools/faqs/faq.php?id=73&t=11
EPA: Environmental Protection Agency. (2018A). Emission Factors for Greenhouse Gas Inventories. See Link to Source
EPA: US Environmental Protection Agency. (2018B). Emissions & generation resource integrated database (eGRID).
Food Logistics. (2009, June 5). Golden Pallet Award: The Biggest is the Best. See Link to Source
Food Marketing Institute. (2018, January). Supermarket Sales by Department – Percent of Total Supermarket Sales. See Link to Source
Heller, M. (2017). Food Product Environmental Footprint Literature Summary: Food Transportation. State of Oregon Department of Environmental Quality.
Kroger. (2015). Kroger Fact Book. The Kroger Co.
Rice, M. (2011). The Expansion of a Retail Chain: An Analysis of Wal-Mart Locations in the United States (Doctoral dissertation, University of North Texas).
Spielman, K. (2007). Food Supply Chains and Food-Miles: An Analysis for Selected Conventional, Non-local Organic and Other-Alternative Foods Sold in Missoula, Montana.
The Retail Owners Institute. (2018A) Fresh Fruit and Vegetable Markets. See Link to Source
The Retail Owners Institute. (2018B) Meat Markets. See Link to Source
The Retail Owners Institute. (2018C) Supermarkets & Grocery Stores. See Link to Source

