Per 18g Protein Serving (2 Ounces)
Carbon
Footprint
Square
Footprint
Water
Footprint


0.16 kg CO2e
3.67 ft2
0.41 Gallons
Monthly Choice
Weekly Choice
Daily Choice
Best Choice
Food Waste
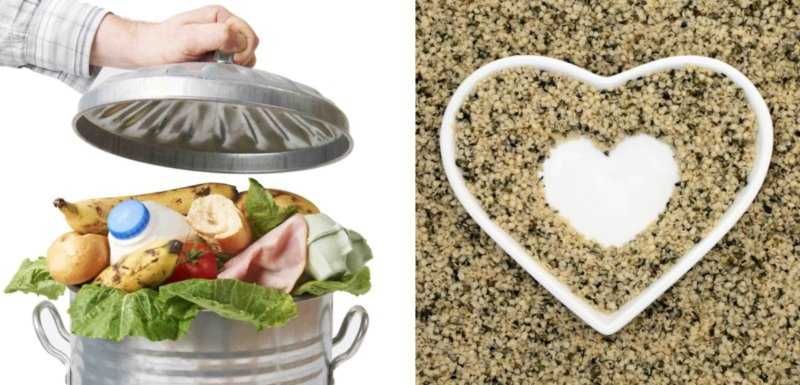
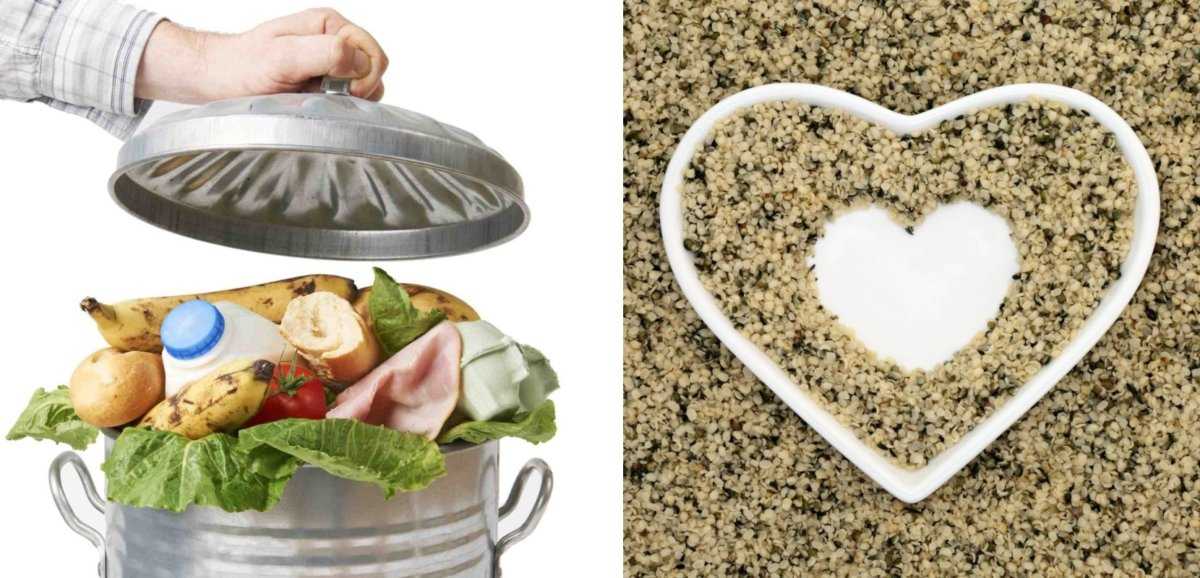
Farmers must produce 30.6% more Hemp Hearts because of food waste (USDA ERS, 2019; based on average value of nuts).
You can save an additional 18.6% by not wasting food!
Farmers must produce 30.6% more Hemp Hearts because of food waste (USDA ERS, 2019; based on average value of nuts).
You can save an additional 18.6% by not wasting food!

Carbon Footprint
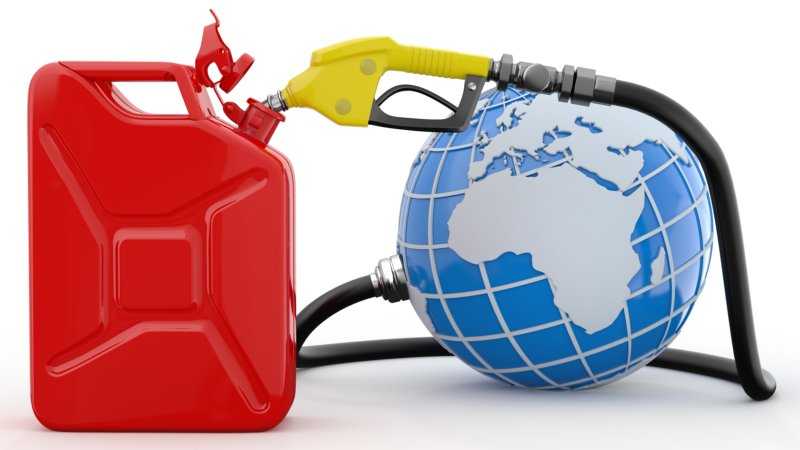
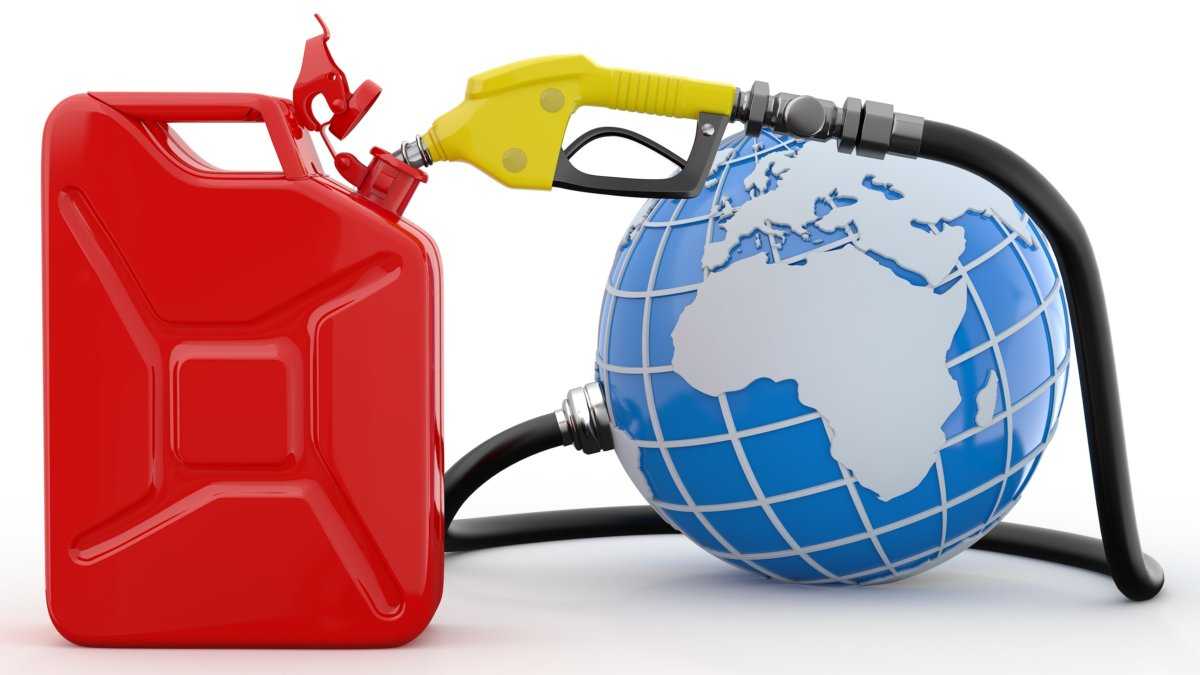
If you ate 2 ounces of Hemp Hearts Every Day for a year, you would use:
6.4
Gallons of Gasoline Equivalent
58.4
kg CO2e

If you ate 2 ounces of Hemp Hearts every day for a year, you would use:
6.4
Gallons of Gasoline Equivalent
58.4
kg CO2e
The Carbon Footprint of Hemp Hearts is 0.16 kg CO2e per 2 ounce serving. The greenhouse gas emissions of Hemp Hearts are 19.6 times lower than beef.
-
9.18 g CO2e / g protein
-
2.90 kg CO2e / kg hemp hearts
-
1.32 kg CO2e / lb hemp hearts
-
31.56% protein for hemp hearts (Based on average of values reported by the Washington State Department of Agriculture, 2017)
Carbon Footprint of Gasoline: 8.89 kg CO2e / gallon
-
Based on EIA (2016)
Carbon Footprint of Hemp at Farm Gate: 0.52 kg CO2e / kg
-
Average of 5 farm gate values reported in 4 peer reviewed studies is 2.00 kg CO2e / ha.
-
Based on a yield of 38,741 hg / ha (See Land Use Calculations), the farm gate emissions are 0.52 kg CO2e / kg.
-
Note: Hemp is grown for seed, fiber, or both seed and fiber. The carbon footprint is 100% allocated to seed, despite some hemp seed crops also being grown for fiber.
-
Value uses the carbon footprint of hemp fiber as a proxy for hemp seed, for which there are fewer LCA studies. Fiber emissions are generally higher for fiber than for seed, reflecting the larger biomass of fiber plants.
| Study | g CO2e / ha | Country | Product |
|---|---|---|---|
| Rana et al., 2014 | 2,330 | NA | Fiber |
| Dornburg et al., 2005 | 1,690 | Netherlands | Seed & Fiber |
| Dornburg et al., 2005 | 1,560 | Poland | Seed & Fiber |
| Finnan & Styles, 2013 | 3,000 | Ireland | Fiber |
| Source Upon Request | 1,422 | UK | Seed |
| Average | 2,000 |
Carbon Footprint After Processing: 1.16 kg CO2e / kg
-
Assuming an average loss of 3.5% from processing hemp seed to hemp hearts, based on Shelling Machine (2020), which states a “Non-Sorted” rate of 2-5%.
-
41.84% of the total hempseed weight removed in the dehulling process (Based on average of values reported by the Washington State Department of Agriculture, 2017), which results in a total primary loss of 43.88%.
-
Primary energy use of the shelling machine is 14.59 kWh / 650 kg, or 0.08 MJ / kg, which is 0.01 kg CO2e / kg (See Carbon Footprint of Cooking for MJ to CO2e Conversion). This does not include transport to the processing facility or building energy use.
-
Based on the low energy use of the shelling machine, Consumer Ecology assumes a higher value based on the full shelling process of peanuts. The University of Arkansas Center for Agricultural Research and Sustainability Technical Report (2012), report a carbon footprint for peanut shelling of 0.046 kg CO2e per kg peanut butter, which is mostly allocated to the shelling machine. Consumer Ecology assumes a shelling carbon footprint of 0.05 CO2e / kg, based on this study. This value is in relative agreement with the processing carbon footprint of vegetables reported by Clune et al. (2017) of 0.06 CO2e / kg.
-
Added the median value of 0.05 kg CO2e / kg value of packaging reported in Clune et al. (2017).
-
Added the median value of 0.09 kg CO2e / kg value of transport to the Regional Distribution Center reported in Clune et al. (2017).
Carbon Footprint of Transport to & Storage at Retail: 0.13 g CO2e / kg
Carbon Footprint of Transport Home: 0.84 kg CO2e / kg
-
Assumed one 8-ounce package purchased.
Carbon Footprint of Food Loss: 0.87 kg CO2e / kg
-
Processing Loss: 43.88%
-
Processing Loss From Food Waste: 0.29 kg CO2e / kg
-
-
Retail Loss: 6%
-
Retail Loss From Food Waste: 0.08 kg CO2e / kg
-
Carbon Footprint at Retail With Food Waste: 1.37 kg CO2e / kg
-
-
Consumer Loss: 18.62%
-
Loss From Consumer Waste: 0.50 kg CO2e / kg
-
-
Carbon Footprint with Food Loss: 2.71 kg CO2e / kg
Carbon Footprint of Disposal: 0.20 kg CO2e / kg
-
26.2% wasted by consumer after 43.88% processing loss.
-
Assuming that all hulls are wasted, which may not happen in practice.
-
Source: Carbon Footprint of Food Disposal
Cradle to Grave Carbon Footprint: 2.91 kg CO2e / kg
Additional Assumptions:
-
Energy use from refrigeration at home is not considered. The electricity load of a refrigerator is considered separate from the foods placed inside of it, because it is assumed that every household has a refrigerator, regardless of how much food is in it. The individual load of opening the refrigerator for one item has been estimated to be around 2 g CO2e / opening (0.02 MJ / opening; Terrell, 2006), and thus does not meet the cutoff for sensitivity of carbon footprints set at 2 significant digits for kg CO2e.
Square Footprint


If you ate 2 ounces of Hemp Hearts Every Day for a year, you would use:
9
Parking Spaces Equivalent
1,400
ft2

If you ate 2 ounces of Hemp Hearts every day for a year, you would use:
9
Parking Spaces Equivalent
1,400
ft2
The Square Footprint of Hemp Hearts is 3.67 ft2 per 2 ounce serving. The land use of Hemp Hearts is 19.5 times lower than beef.
0.20 ft2 / g protein
64.69 ft2 / kg hemp hearts
29.34 ft2 / lb hemp hearts
31.56% protein for hemp hearts (Based on average of values reported by the Washington State Department of Agriculture, 2017)
Square-Footprint of an Average Parking Space: 144 ft2 / space
Based on the average dimensions stated by Franklin Street (2019).
For parallel or perpendicular parking spaces, the average length is between 16-18 feet; the average width is between 7.9-9 feet.
Square-Footprint Calculations:
Land use data based on FAO Stat (2020). Global yield values are reported as follows:
2013: 36,671 hg / ha
2014: 41,902 hg / ha
2015: 32,665 hg / ha
2016: 36,855 hg / ha
2017: 45,612 hg / ha
5-year Average: 38,741 hg / ha
This value converts to 36.00 g / ft2
41.84% of the total hempseed weight is removed in the dehulling process (Based on average of values reported by the Washington State Department of Agriculture, 2017).
Assuming an average loss of 3.5% of hemp hearts from processing hemp seed to hemp hearts, based on Shelling Machine (2020), which states a “Non-Sorted” rate of 2-5%.
Final figure adjusted to include an estimated food waste of 23.5% (Processing + Averaged Waste of Nuts From USDA ERS, 2019). It will take 30.7% more hemp hearts produced to deliver the nutrition of 1 serving consumed.
Water Footprint


If you ate 2 ounces of Hemp Hearts Every Day for a year, you would use:
1.0
Hours in the Shower Equivalent
149.7
Gallons of Water

If you ate 2 ounces of Hemp Hearts every day for a year, you would use:
1.0
Hours in the Shower Equivalent
149.7
Gallons
The Water Footprint of Hemp Hearts is 0.41 gallons per 2 ounce serving. The water use of a Hemp Hearts is 85.5 times lower than beef.
0.023 gallons / g protein
7.4 gallons / kg hemp hearts
3.4 gallons / lb hemp hearts
- 31.56% protein for hemp hearts (Based on average of values reported by the Washington State Department of Agriculture, 2017)
Water Footprint of Showering: 2.5 gallons per minute
Based on Home Water Works, (2019)
Water Footprint of Hemp Seed:
12 m3 / tonne (Mekonnen & Hoekstra, 2011)
This value converts to 3.17 gallons / kg
Water Footprint Calculations:
41.84% of the total hempseed weight is removed in the dehulling process (Based on average of values reported by the Washington State Department of Agriculture, 2017).
Assuming an average loss of 3.5% of hemp hearts from processing hemp seed to hemp hearts, based on Shelling Machine (2020), which states a “Non-Sorted” rate of 2-5%.
Final figure adjusted to include an estimated food waste of 23.5% (Processing + Averaged Waste of Nuts From USDA ERS, 2019). It will take 30.7% more hemp hearts produced to deliver the nutrition of 1 serving consumed.
Green and greywater are not listed because only blue water is directly linked to irrigation and unsustainable water withdrawal.
References
Clune, S., Crossin, E., & Verghese, K. (2017). Systematic review of greenhouse gas emissions for different fresh food categories. Journal of Cleaner Production, 140, 766-783.
Dornburg, V., Termeer, G., & Faaij, A. P. (2005). Economic and greenhouse gas emission analysis of bioenergy production using multi-product crops—case studies for the Netherlands and Poland. Biomass and Bioenergy, 28(5), 454-474.
Energy Information Administration (EIA; February 2, 2016). Carbon Dioxide Emissions Coefficients. See Link to Source
Home Water Works. (2019). Showers. See Link to Source
Food and Agriculture Organization (FAO). 2020. FAOSTAT Food and Agriculture Data. See Link to Source
Finnan, J., & Styles, D. (2013). Hemp: a more sustainable annual energy crop for climate and energy policy. Energy Policy, 58, 152-162.
Franklin Street. (May 23, 2019). How Large is a Parking Space? See Link to Source
Mekonnen, M. M., & Hoekstra, A. Y. (2011). The green, blue and grey water footprint of crops and derived crop products.
Rana, S., Pichandi, S., Parveen, S., & Fangueiro, R. (2014). Natural plant fibers: production, processing, properties and their sustainability parameters. In Roadmap to Sustainable Textiles and Clothing (pp. 1-35). Springer, Singapore.
Shelling Machine. 2020. Industrial Hemp Seed Shelling Machine. See Link to Source
Terrell, W. (2006). Energy Requirements of Refrigerators Due to Door Opening Conditions. International Refrigeration and Air Conditioning Conference. Paper 836.
The Engineering ToolBox. (2003). Specific Heat of Food and Foodstuff. See Link to Source
University of Arkansas Center for Agricultural Research and Sustainability. (2012). National Scan-level Life Cycle Assessment for Production of US Peanut Butter. Technical Report 3Q-2012-01.
USDA ERS: US Department of Agriculture Economic Research Service. (2019). Loss-Adjusted Food Availability.
Washington State Department of Agriculture. 2017. Preliminary Assessment of Hemp Seed Products as Feed Ingredients for Laying Hens. A Report to the Legislature in response to HB1268, Chapter 106, Laws of 2015, 64th Legislature, 2015 Regular Session. See Link to Source


