Per 34g Protein Serving (1/2 cup of dry beans)
Carbon
Footprint
Square
Footprint
Water
Footprint

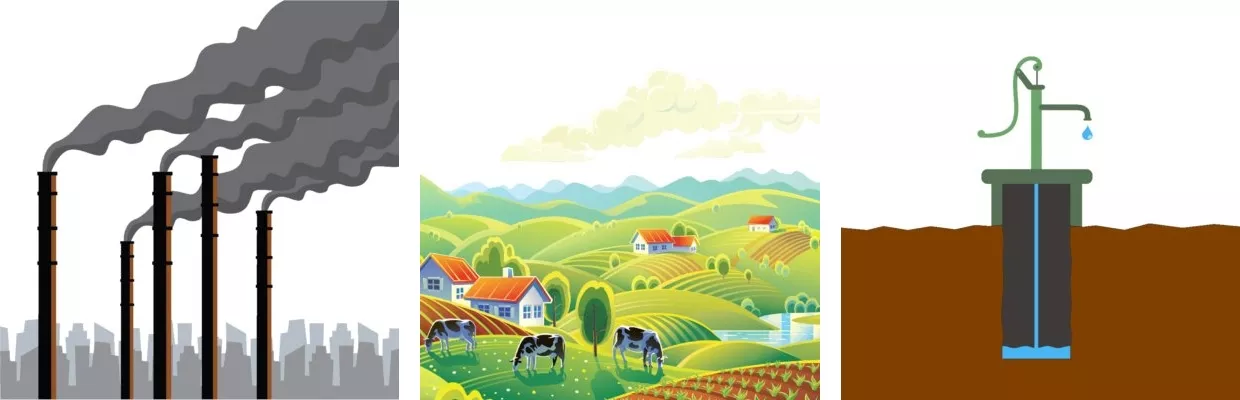
0.60 kg CO2e
7.95 ft2
8.10 Gallons

Monthly Choice
Weekly Choice
Daily Choice
Best Choice
Food Waste


Consumers are estimated to waste on average 10% of all Soy purchased (USDA ERS, 2019; based on legumes).

Food waste increases the environmental impact of Soy by 11.1%
Consumers are estimated to waste on average 10% of all Soy purchased (USDA ERS, 2019; based on legumes).
Carbon Footprint


If you ate 1/2 cup of Soy every day for a year, you would use:
24.6
Gallons of Gasoline Equivalent
218.7
kg CO2e
If you ate 1/2 cup of Soy every day for a year, you would use:
24.6
Gallons of Gasoline Equivalent
218.7
kg CO2e
The Carbon Footprint of Soy is 6.44 kg CO2e per kg. The greenhouse gas emissions of Soy are 24.5 times lower than beef.
17.7 g CO2e / g protein
2.89 kg CO2e / 2,000 kcal
6.44 kg CO2e / kg
2.92 kg CO2e / lb
364.9 g protein / kg (Source: Reported by Poore & Nemeck, 2018)
4,460 kcal / kg (Source: USDA Food Data Central, 2019)
Carbon Footprint of Gasoline: 8.89 kg CO2e / gallon
Based on EIA (2016)
Carbon Footprint of Soybeans at the Farm Gate: 3.00 kg CO2e / kg
Global weighted average reported by Poore & Nemeck (2018). The study is the most thorough meta-analysis for the environmental impact of food published to date. The value represents 47 Life Cycle Analyses (LCA), mostly in the peer reviewed literature. Individual LCA studies are weighted according to their representativeness of the country they were performed in, as well as that country’s global production. The study re-samples the dataset to fill in gaps for missing data and uncertainty.
Carbon footprint was back calculated from the value reported for tofu, reported by Poore & Nemeck (2018). See the Square Footprint “Data and Assumptions” section for a description of this process.
Soybeans at 13% moisture.
Carbon footprint includes all on-farm processes, as well and land use change with climate feedbacks.
Carbon Footprint at Processor Gate: 3.59 CO2e / kg
Transport emissions of 0.07 kg CO2e / kg to the processor. Consumer Ecology uses the value reported by Poore & Nemeck (2018) for “Leguminous Crops.”
Assumes no emission from the packaging process.
A processing loss of 5% is added, according to the losses reported by Poore & Nemeck (2018) for Legumes in the United States. Consumer Ecology diverges from the world average value at this point in the life cycle.
Emissions from packaging of 0.36 kg CO2e / kg. Consumer Ecology uses the value reported by Poore & Nemeck (2018) for “Beans, Pluses.”
Carbon Footprint at Retail Gate: 3.91 kg CO2e / kg
Transport emissions of 0.04 kg CO2e / kg to retail. Consumer Ecology uses the value reported by Poore & Nemeck (2018) for “Other Annual Crops.”
Retail emissions of 0.04 kg CO2e/ kg at retail. Consumer Ecology uses the value for non-refrigerated items reported by Poore & Nemeck (2018) for “Ambient.”
Loss emissions at retail of 0.22 kg CO2e / kg. The USDA ERS Loss Adjusted Food Availability (2019) reports a retail loss of 6% for legumes in the United States.
Carbon Footprint of Retail to Home: 0.44 kg CO2e / kg
Assumed 1 package (1 lb) purchased
Carbon Footprint of Cooking: 1.01 kg CO2e / kg
Cooked at a ratio of 3 cups of water per cup of soybeans for 3.5 hours according to Central Market (2020).
Model assumes a lid on the pot.
Assumes a proxy heat capacity for kidney beans of 1.17 J / g*C, as reported by Engineering Toolbox (2020).
For energy use calculators and the proportion of US Household size used to determine cooking proportions, see the “Carbon Footprint of Cooking” page.
Source: Carbon Footprint of Cooking
Carbon Footprint of Consumer Food Loss: 1.05 kg CO2e / kg
The USDA ERS Loss Adjusted Food Availability (2019) reports a consumer loss of 10% for legumes in the United States.
Carbon Footprint of Disposal: 0.03 kg CO2e / kg
10% wasted
Source: Carbon Footprint of Food Disposal
Cradle to Grave Carbon Footprint: 6.44 kg CO2e / kg
Additional Assumptions:
Energy use from refrigeration at home is not considered. The electricity load of a refrigerator is considered separate from the foods placed inside of it, because it is assumed that every household has a refrigerator, regardless of how much food is in it. The individual load of opening the refrigerator for one item has been estimated to be around 2 g CO2e / opening (0.02 MJ / opening; Terrell, 2006), and thus does not meet the cutoff for sensitivity of carbon footprints set at 2 significant digits for kg CO2e.
Square Footprint


If you ate 1/2 cup of Soy every day for a year, you would use:
20
Parking Spaces Equivalent
2,901
ft2
If you ate 1/2 cup of Soy every day for a year, you would use:
20
Parking Spaces Equivalent
2,901
ft2
The Square Footprint of Soy is 84.45 ft2 per kg. The land use of Soy is 58.9 times lower than beef.
0.234 ft2 / g protein
38.32 ft2 / 2,000 kcal
85.45 ft2 / kg
38.76 ft2 / lb
364.9 g protein / kg (Source: Reported by Poore & Nemeck, 2018)
4,460 kcal / kg (Source: USDA Food Data Central, 2019)
Square Footprint at Farm Gate: 6.38 m2 / kg
Global weighted average reported by Poore & Nemeck (2018). The study is the most thorough meta-analysis for the environmental impact of food published to date. The value represents 47 Life Cycle Analyses (LCA), mostly in the peer reviewed literature. Individual LCA studies are weighted according to their representativeness of the country they were performed in, as well as that country’s global production. The study re-samples the dataset to fill in gaps for missing data and uncertainty.
Poore & Nemeck (2018) does not directly report environmental impacts for soybeans, therefore Consumer Ecology back calculated the ratio of soybeans to tofu by comparing stated and calculated yields for soybeans to the values reported for 1 kg of tofu. Consumer Ecology compared land use on the farm, from seed, and from fallow land prior to processing, to arrive at this value. This comparison resulted in a 1.99:1 ratio of soybeans to tofu, per kg. The original study values for soybeans were used for the Square Footprint of soybeans, but the ratio was used to calculate the carbon footprint and water footprint, as stated per kg of Tofu, for farm gate values only.
At the stated 16% protein functional unit for tofu reported by Poore & Nemeck (2018), a doubling of this protein ratio results in soybeans having a 32% protein content at 13% moisture. This value is in relative agreement with the protein content stated by the USDA Food Data Central (2019) of 36.49%, and the average value for 72 districts of 34.6% in the crop year 2014 (United Soybean Board, 2016).
Value reported includes on farm post-harvest handling and storage losses reported by Poore & Nemeck (2018).
Square Footprint After Packaging & Retail (Retail Gate): 76.90 ft2 / kg
Poore & Nemeck (2018) report a processing loss of 5% for “legumes” in the United States. Consumer Ecology diverges from the world average value at this point in the life cycle. The 5% loss increases the Square Footprint by 0.34 m2 / kg, which totals 6.72 m2 / kg.
The USDA ERS Loss Adjusted Food Availability (2019) reports a retail loss of 6% for legumes in the United States. The 6% loss increases the Square Footprint by 0.42 m2 / kg, which totals 7.14 m2 / kg. This value converts to 76.90 ft2 / kg.
Square Footprint After Food Loss: 85.45 ft2 / kg
The USDA ERS Loss Adjusted Food Availability (2019) reports a consumer loss of 10% for legumes in the United States.
Total consumer food loss of 10% increases the Square Footprint by 8.55 ft2 / kg, or 11.1%.
Water Footprint


If you ate 1/2 cup of Soy every day for a year, you would use:
19.7
Hours in the Shower Equivalent
2,957
Gallons of Water
If you ate 1/2 cup of Soy every day for a year, you would use:
19.7
Hours in the Shower Equivalent
2,957
Gallons
The Water Footprint of Soy is 87.1 gallons per kg. The water use of Soy is 14.0 times lower than beef.
-
0.239 gallons / g protein
-
39.1 gallons / 2,000 kcal
-
87.1 gallons / kg
-
39.5 gallons / lb
-
364.9 g protein / kg (Source: USDA Food Data Central, 2019)
-
4,460 kcal / kg (Source: USDA Food Data Central, 2019)
Water Footprint at Farm Gate: 264.97 L / kg
-
Global weighted average reported by Poore & Nemeck (2018). The study is the most thorough meta-analysis for the environmental impact of food published to date. The value represents 47 Life Cycle Analyses (LCA), mostly in the peer reviewed literature. Individual LCA studies are weighted according to their representativeness of the country they were performed in, as well as that country’s global production. The study re-samples the dataset to fill in gaps for missing data and uncertainty.
-
Carbon footprint was back calculated from the value reported for tofu, reported by Poore & Nemeck (2018). See the Square Footprint “Data and Assumptions” section for a description of this process.
-
Soybeans at 13% moisture.
Water Footprint After Packaging & Retail (Retail Gate): 78.39 gal / kg
-
Poore & Nemeck (2018) report a processing loss of 5% for “legumes” in the United States. Consumer Ecology diverges from the world average value at this point in the life cycle. The 5% loss increases the Water Footprint by 13.95 L / kg, which totals 278.92 L / kg.
-
The USDA ERS Loss Adjusted Food Availability (2019) reports a retail loss of 6% for legumes in the United States. The 6% loss increases the Water Footprint by 17.80 L /kg, which totals 296.72 L / kg.
-
This value converts to 78.39 gal / kg.
Water Footprint After Food Loss: 87.10 gallons / kg
-
The USDA ERS Loss Adjusted Food Availability (2019) reports a consumer loss of 10% for legumes in the United States.
-
Total food loss of 10% increases the Water Footprint by 8.71 gallons / kg, or 11.1%.
References
Energy Information Administration (EIA; February 2, 2016). Carbon Dioxide Emissions Coefficients. See Link to Source
Central Market. (2020). Cooking Guide for Dried Beans. See Link to Source.
Home Water Works. (2019). Showers. See Link to Source
Franklin Street. (May 23, 2019). How Large is a Parking Space? See Link to Source
Poore, J., & Nemecek, T. (2018). Reducing food’s environmental impacts through producers and consumers. Science, 360(6392), 987-992.
Terrell, W. (2006). Energy Requirements of Refrigerators Due to Door Opening Conditions. International Refrigeration and Air Conditioning Conference. Paper 836.
The Engineering ToolBox. (2003). Specific Heat of Food and Foodstuff. See Link to Source
United Soybean Board. (January 1, 2016). Average Soybean Protein and Oil at 13 Percent Moisture: Crop Year 2014. See Link to Source
USDA ERS: US Department of Agriculture Economic Research Service. (2019). Loss-Adjusted Food Availability. See Link to Source
USDA Food Data Central: US Department of Agriculture – Agricultural Research Service. (April 1, 2019). Soybeans, mature seeds, raw. See Link to Source
